If you are looking for proof that email is dead, you won't find it in the data. Even in 2026, email remains the undisputed revenue engine of B2B business.
However, the game has changed. The problem with most articles about email marketing stats is that they just dump raw numbers on you without direction. Knowing the average open rate is useful, but it doesn't tell you how to fix a failing campaign.
This article is different. We aren't just listing numbers; we are translating stats about email marketing into decisions. We have split the data clearly into two camps: what is driving revenue right now, and what is silently killing your conversion rates.
Key Email Marketing Stats You Should Know in 2026
Before we judge success or failure, we need a baseline. The foundational metrics that every B2B marketer should have memorized to benchmark their performance.
Benchmarks have shifted due to privacy changes and AI adoption, but they still serve as a vital pulse check. If your metrics fall significantly below these averages, it is a signal to audit your strategy.
To understand where you stand, compare your current results against these global averages for 2025-2026:
- Average Open Rate: The global B2B average now hovers around 39%. Anything below 20% indicates a serious deliverability or subject line issue.
- Average Click-Through Rate (CTR): Expect a CTR between 2-3%. High open rates with low CTR usually mean your content isn't matching the promise of your subject line.
- ROI Benchmarks: Email continues to deliver the highest ROI of any channel, generating $36 to $42 for every $1 spent.
- Conversion Rate: The average landing page conversion rate from email traffic is roughly 3-5%, depending on the offer complexity.
Now that we have established the baseline for success, let's look at the specific strategies that are driving these numbers up.
B2B Email Marketing Stats That Show What Works
Data clearly shows that "spray and pray" is dead. The winners in 2026 are using data to be more relevant, not just more frequent.
Personalization & Relevance Stats
"Dear [First Name]" is no longer enough. Stats about email marketing prove that deep personalization is the biggest lever you have.
- Revenue Lift: Segmented campaigns drive a 760% increase in revenue compared to non-segmented blasts.
- Open Rate Impact: Personalized subject lines are 26% more likely to be opened.
- Relevance Wins: 72% of B2B buyers say they will only engage with personalized messaging that speaks to their specific pain points.
Subject Line & Copywriting Stats
The battle for attention is won or lost in the preview pane. Your subject line is the gatekeeper.
- Character Count: Subject lines between 28-39 characters consistently get the highest open rates.
- Curiosity Gap: Question-based subject lines generate 15% more opens than statements.
- Spam Triggers: Using aggressive words like "Free," "Urgent," or "Guarantee" increases spam complaints by 30%.
Timing & Send Frequency Stats
When you send matters almost as much as what you send.
- Best Days: Tuesday and Thursday remain the peak performers for B2B engagement.
- Best Times: Best time to send cold emails between 9 AM and 11 AM captures the morning workflow without getting buried in the overnight purge.
- Cadence: Weekly newsletters see the highest engagement, while daily sends see a 40% higher unsubscribe rate.
Follow-Up & Sequencing Stats
Most sales are lost because the sender gave up too soon. These b2b email marketing stats prove the power of persistence.
- The Magic Number: 80% of sales require at least 5 follow-ups, yet 44% of salespeople give up after one rejection.
- Reply Spikes: The first follow-up email (sent 2-3 days later) often sees a 40% higher reply rate than the initial email.
- Sequence Success: Automated multi-touch sequences generate 2x more opportunities than manual ad-hoc emails.
Mobile-First Optimization Stats
The B2B buyer is no longer tethered to a desk.
- Mobile Dominance: 41.9% of all B2B emails are opened on mobile devices.
- The Delete Button: 70% of people will immediately delete an email if it doesn't display correctly on their phone.
- Click Rates: Emails optimized for mobile see a 15% increase in unique mobile clicks.
While understanding what works is crucial, avoiding common pitfalls is equally important for maintaining a healthy domain.
Email Marketing Stats That Show What Doesn’t Work
Knowing what to avoid is just as important as knowing what to do. Many B2B teams are silently failing because they ignore infrastructure and data hygiene. These stats show the cost of cutting corners.
Poor List Quality & Targeting Stats
Bad data doesn't just waste time; it destroys your reputation.
- Bounce Rates: A bounce rate over 2% can get your domain flagged by Google and Outlook.
- Purchased Lists: Campaigns sent to purchased lists have 50% lower open rates and 10x higher spam complaint rates.
- Data Decay: B2B data decays at a rate of 22.5% per year as people change jobs, making regular cleaning mandatory.
Generic Messaging & Over-Automation Stats
Robotic outreach is ignored.
- Template Fatigue: "Copy-paste" templates have seen a 35% drop in reply rates over the last two years.
- Trust Gap: 60% of prospects say they can identify an automated email instantly and will delete it without reading.
Deliverability & Infrastructure Failure Stats
If you aren't landing in the inbox, nothing else matters.
- Inbox Placement: Only 79% of permission-based emails actually reach the inbox globally.
- Warm-Up Impact: Domains that skip the warm-up process are 3x more likely to land in spam during the first week of outreach.
Understanding these pitfalls is key, but it helps to see how benchmarks differ between warm newsletters and cold outreach.
Industry-Specific B2B Email Marketing Stats
Context is king. A marketing agency will naturally have different metrics than a manufacturing firm.
SaaS & Tech
- Open Rate: 36%
- CTR: 2.6%
- Insight: Tech audiences are wary of automation but responsive to high-value data.
Agencies & Services
- Open Rate: 38%
- CTR: 2.9%
- Insight: Highly competitive inbox environment requires stronger subject lines.
Recruitment & Staffing
- Open Rate: 32%
- CTR: 1.8%
- Insight: Requires extreme relevance to the candidate or hiring manager's immediate need.
Enterprise vs SMB
- Enterprise: Lower open rates (harder to reach decision makers) but higher deal value.
- SMB: Higher engagement rates but lower average contract value.
Just as industries differ, metrics also evolve as a prospect moves deeper into your sales funnel.
Email Marketing Stats by Funnel Stage
Different stages of the buyer journey require different metrics.
Awareness Stage (Top of Funnel):
- Primary Metric: Open Rate (Benchmark: 39%)
- The Stat: Educational content generates 48% more opens than product pitches at this stage.
- Success Definition: You have earned their attention and they recognize your brand name in the inbox.
Consideration Stage (Middle of Funnel):
- Primary Metric: Click-Through Rate (Benchmark: 2-3%)
- The Stat: Emails with a single, clear CTA increase clicks by 371% and sales by 1617%.
- Success Definition: You have earned their interest. They are actively consuming your case studies, whitepapers, or demo videos.
Conversion Stage (Bottom of Funnel):
- Primary Metric: Reply Rate (Benchmark: 5-10%)
- The Stat: Direct, low-friction questions ("Can we chat Tuesday?") get 2.5x more replies than complex meeting requests.
- Success Definition: You have started a conversation. The prospect is ready to move from a passive reader to an active lead.
Having all these numbers is great, but interpreting them correctly is what separates successful teams from the rest.
What These Email Marketing Stats Mean for B2B Teams
The stats on email marketing tell a clear story: volume is out, and precision is in. The days of buying a list of 10,000 leads and blasting them with a generic template are over. The pattern across winning campaigns is clear they treat the inbox as a sacred space.Here is how to translate these numbers into a winning strategy:
- Relevance is the New Currency: With open rates stabilizing around 39%, the challenge isn't getting seen; it's getting read. The stats on personalization show that generic messaging is essentially invisible. You must segment your audience by industry, role, or pain point to see results.
- Persistence Pays, but Only with Value: The fact that 80% of sales happen after the 5th touch doesn't mean you should send "Just bumping this" five times. It means you need a sequence of value-added follow-ups case studies, insights, or new data that earn the right to a reply.
- Mobile Experience is Non-Negotiable: If your email looks cluttered on an iPhone, 41.9% of your audience won't just ignore it; they will delete it. Formatting for small screens short paragraphs, clear questions, and no massive images is now a deliverability requirement, not a design choice.
- Speed Wins Deals: The drastic drop in engagement over time means your window of opportunity is small. Automated tools that reply instantly or follow up perfectly on time (like Oppora) are no longer a luxury; they are necessary to compete with the speed of the market.
Common mistakes repeated despite data include sending too frequently without value and failing to segment lists. The data shows that "less is more" when the "less" is highly relevant.
To act on these insights at scale without burning out, modern teams are turning to advanced automation tools.
How Oppora.ai Improves Your Email Marketing Metrics
Oppora.ai is an AI powered outreach platform that turns cold email into a fully automated system. It solves the biggest bottleneck in B2B email: consistent execution.
Automating The Perfect Workflow
Most B2B marketers spend 80% of their time on list building and setup. Oppora flips this metric.
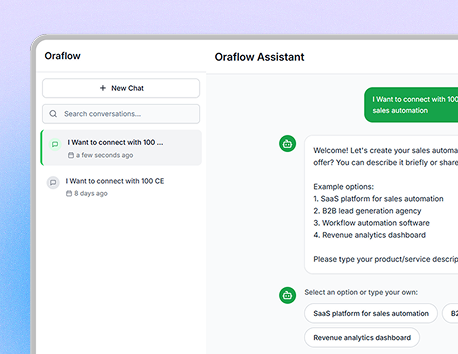
- Goal-Based Campaign Setup (Oraflow): Instead of manually searching for leads and building spreadsheets, you simply type a goal like "Connect with 100 CEOs in the SaaS industry." Oppora’s AI Planner automatically builds the entire workflow finding companies, extracting validated emails, enriching data, and generating the campaign sequence.
- Precision Control: Oraflow includes smart checkpoints. You get to review and approve the companies and leads the AI finds before the campaign launches. This ensures you maintain the relevance (a key "What Works" stat) without doing the manual grunt work.
Solving Infrastructure Challenges
The data proves that skipping warm-up kills deliverability.
- Infrastructure & Warm-Up: Oppora includes built-in domain warm-up and sender identity matching (Gmail to Gmail) to ensure you land in the primary inbox, not spam.
- Clean Data: With a database of 700M+ global leads, Oppora helps you avoid the high bounce rates associated with bad lists.
Handling Replies at Scale (AI Reply Agent)
Speed to lead matters. Oppora includes a dedicated AI reply agent called Replyora. It acts just like a human assistant, reading replies, understanding intent, answering questions, and even booking meetings instantly. This ensures you capitalize on every engagement signal immediately without manual intervention.
Conclusion: The Summary of What Works (And What Doesn't)
The data for 2026 is clear: precision beats volume. While email remains the ROI king at $36 for every dollar spent, success now requires abandoning "spray and pray" tactics. The winners leverage deep segmentation, mobile-first design, and relentless, automated persistence.
Stats are guideposts, not laws. Use these benchmarks to identify leaks, but always trust your own context. By combining clean data with intelligent tools, you can build a predictable revenue engine that outperforms the averages.
Ready to align your strategy with what works? Oppora.ai automates the data-backed tactics like smart sequencing and instant replies so you can improve your metrics without increasing your workload.
Frequently Asked Questions (FAQ)
What is a good open rate for B2B cold email?
For highly personalized cold outreach, aim for 40-60%. If you are below 30%, focus on improving your subject lines and deliverability. For newsletters, anything above 22% is considered healthy.
Does sending more emails increase conversion rates?
Only up to a point. The stats show a sharp drop-off in engagement after the 5th or 6th follow-up. However, sending too frequently (e.g., daily) increases unsubscribe rates by 40%. The sweet spot is a multi-touch sequence spaced over several weeks.
How does AI impact email deliverability?
AI tools that use predictive sending and warm-up features significantly improve deliverability. They ensure emails are sent when prospects are active and help maintain a positive sender reputation by spacing out volume.
Is long-form or short-form content better for B2B?
Short-form wins for cold outreach. Emails with 50-125 words see the highest response rates (over 50%). Decision-makers scan emails on mobile and value brevity over detailed essays.